Evidence & Progress

Evidence & Progress

A dated record of practice, with sources and limits attached. Personal self-assessments are prompts for reflection, not certifications.

Practice compass

Four habits, with evidence.

Qualitative bands first. Earlier numeric scores remain inside each methodology disclosure.

Verify

Strong

Trace claims to original sources and keep uncertainty visible.

Last reviewed Aug 24, 2026

Next: Keep tracing claims to primary sources before reusing them.

Methodology & historical score

Qualitative self-assessment, not an external grade. Historical score: 88/100, recorded before this refresh. No new numerical assessment has been made.

Source workflow, AI-summary checks, citation support

Build

Growing

Create tools and documentation that lower friction for others.

Last reviewed Aug 24, 2026

Next: Connect engineering fundamentals with small, documented builds.

Methodology & historical score

Qualitative self-assessment, not an external grade. Historical score: 76/100, recorded before this refresh. No new numerical assessment has been made.

Peer library, checklists, accessible-form review

Historical record

July 2026 snapshot.

Values are retained from the original self-reported record. These are not live counters, independently audited totals, or counts of the current project library.

July 2026 snapshot

11 · Coding projects completed

Projects that include a clear public good, learning outcome, or safety angle.

Historical goal: 12. +4 since April

July 2026 snapshot

57 · GitHub commits in July 2026

Commit activity on portfolio, learning, and community-oriented coding work.

Historical goal: 60. Steady across 5 weeks

Year to date through July 2026

26 · Educational resources shared

Guides, articles, and checklists shared with peers to support safer digital habits.

Historical goal: 30. 8 added since April

Year to date through July 2026

20 · Reflections written

Short written reviews of online choices, lessons, and course corrections.

Historical goal: 24. 5 new field notes

Year to date through July 2026

112h · Hours spent on digital learning

Time spent studying privacy, security, media literacy, ethics, and related skills.

Historical goal: 140. 39h since April

Year to date through July 2026

34 · Community support contributions

Peer support actions such as answering questions, reviewing drafts, and sharing fixes.

Historical goal: 42. 7 new contributions

Year to date through July 2026

15 · Digital safety topics studied

Distinct topics studied deeply enough to summarize and apply in practice.

Historical goal: 18. Threat modeling added

July 2026 snapshot

5/5 · Monthly goals completed

Progress against the specific habits and commitments I set at the start of the month.

Historical goal: 6. Accessibility goal completed

July 2026 snapshot

28 days · Improvement streak in July 2026

Consecutive days with at least one intentional learning, reflection, or contribution action.

Historical goal: 35. Longest run this year
Historical learning log

Consistency has a shape.

The monthly and weekly logs have different aggregation windows; do not add them together.

Historical learning log · November 2025–July 2026

Historical learning log · November 2025–July 2026
PeriodHours
Nov8
Dec10
Jan11
Feb12
Mar14
Apr18
May11
Jun13
Jul15
Weekly data
Historical learning log · June 22–July 27, 2026
PeriodHours
Jun 225
Jun 296
Jul 64
Jul 137
Jul 208
Jul 276

July 2026 snapshot

Small actions, repeated on purpose.

Historical self-reported habit assessments; not current streaks.

Verify before sharing

Every time · 94% · On track

Review account permissions

Monthly · 82% · On track

Publish one useful resource

Weekly · 71% · Building

Protect focus after 9 PM

Daily · 68% · Building

Document AI assistance

Per project · 89% · On track

Context & Sources

Access did not arrive everywhere at once.

A historical regional dataset retained from the fieldbook. Missing years are explicitly marked.

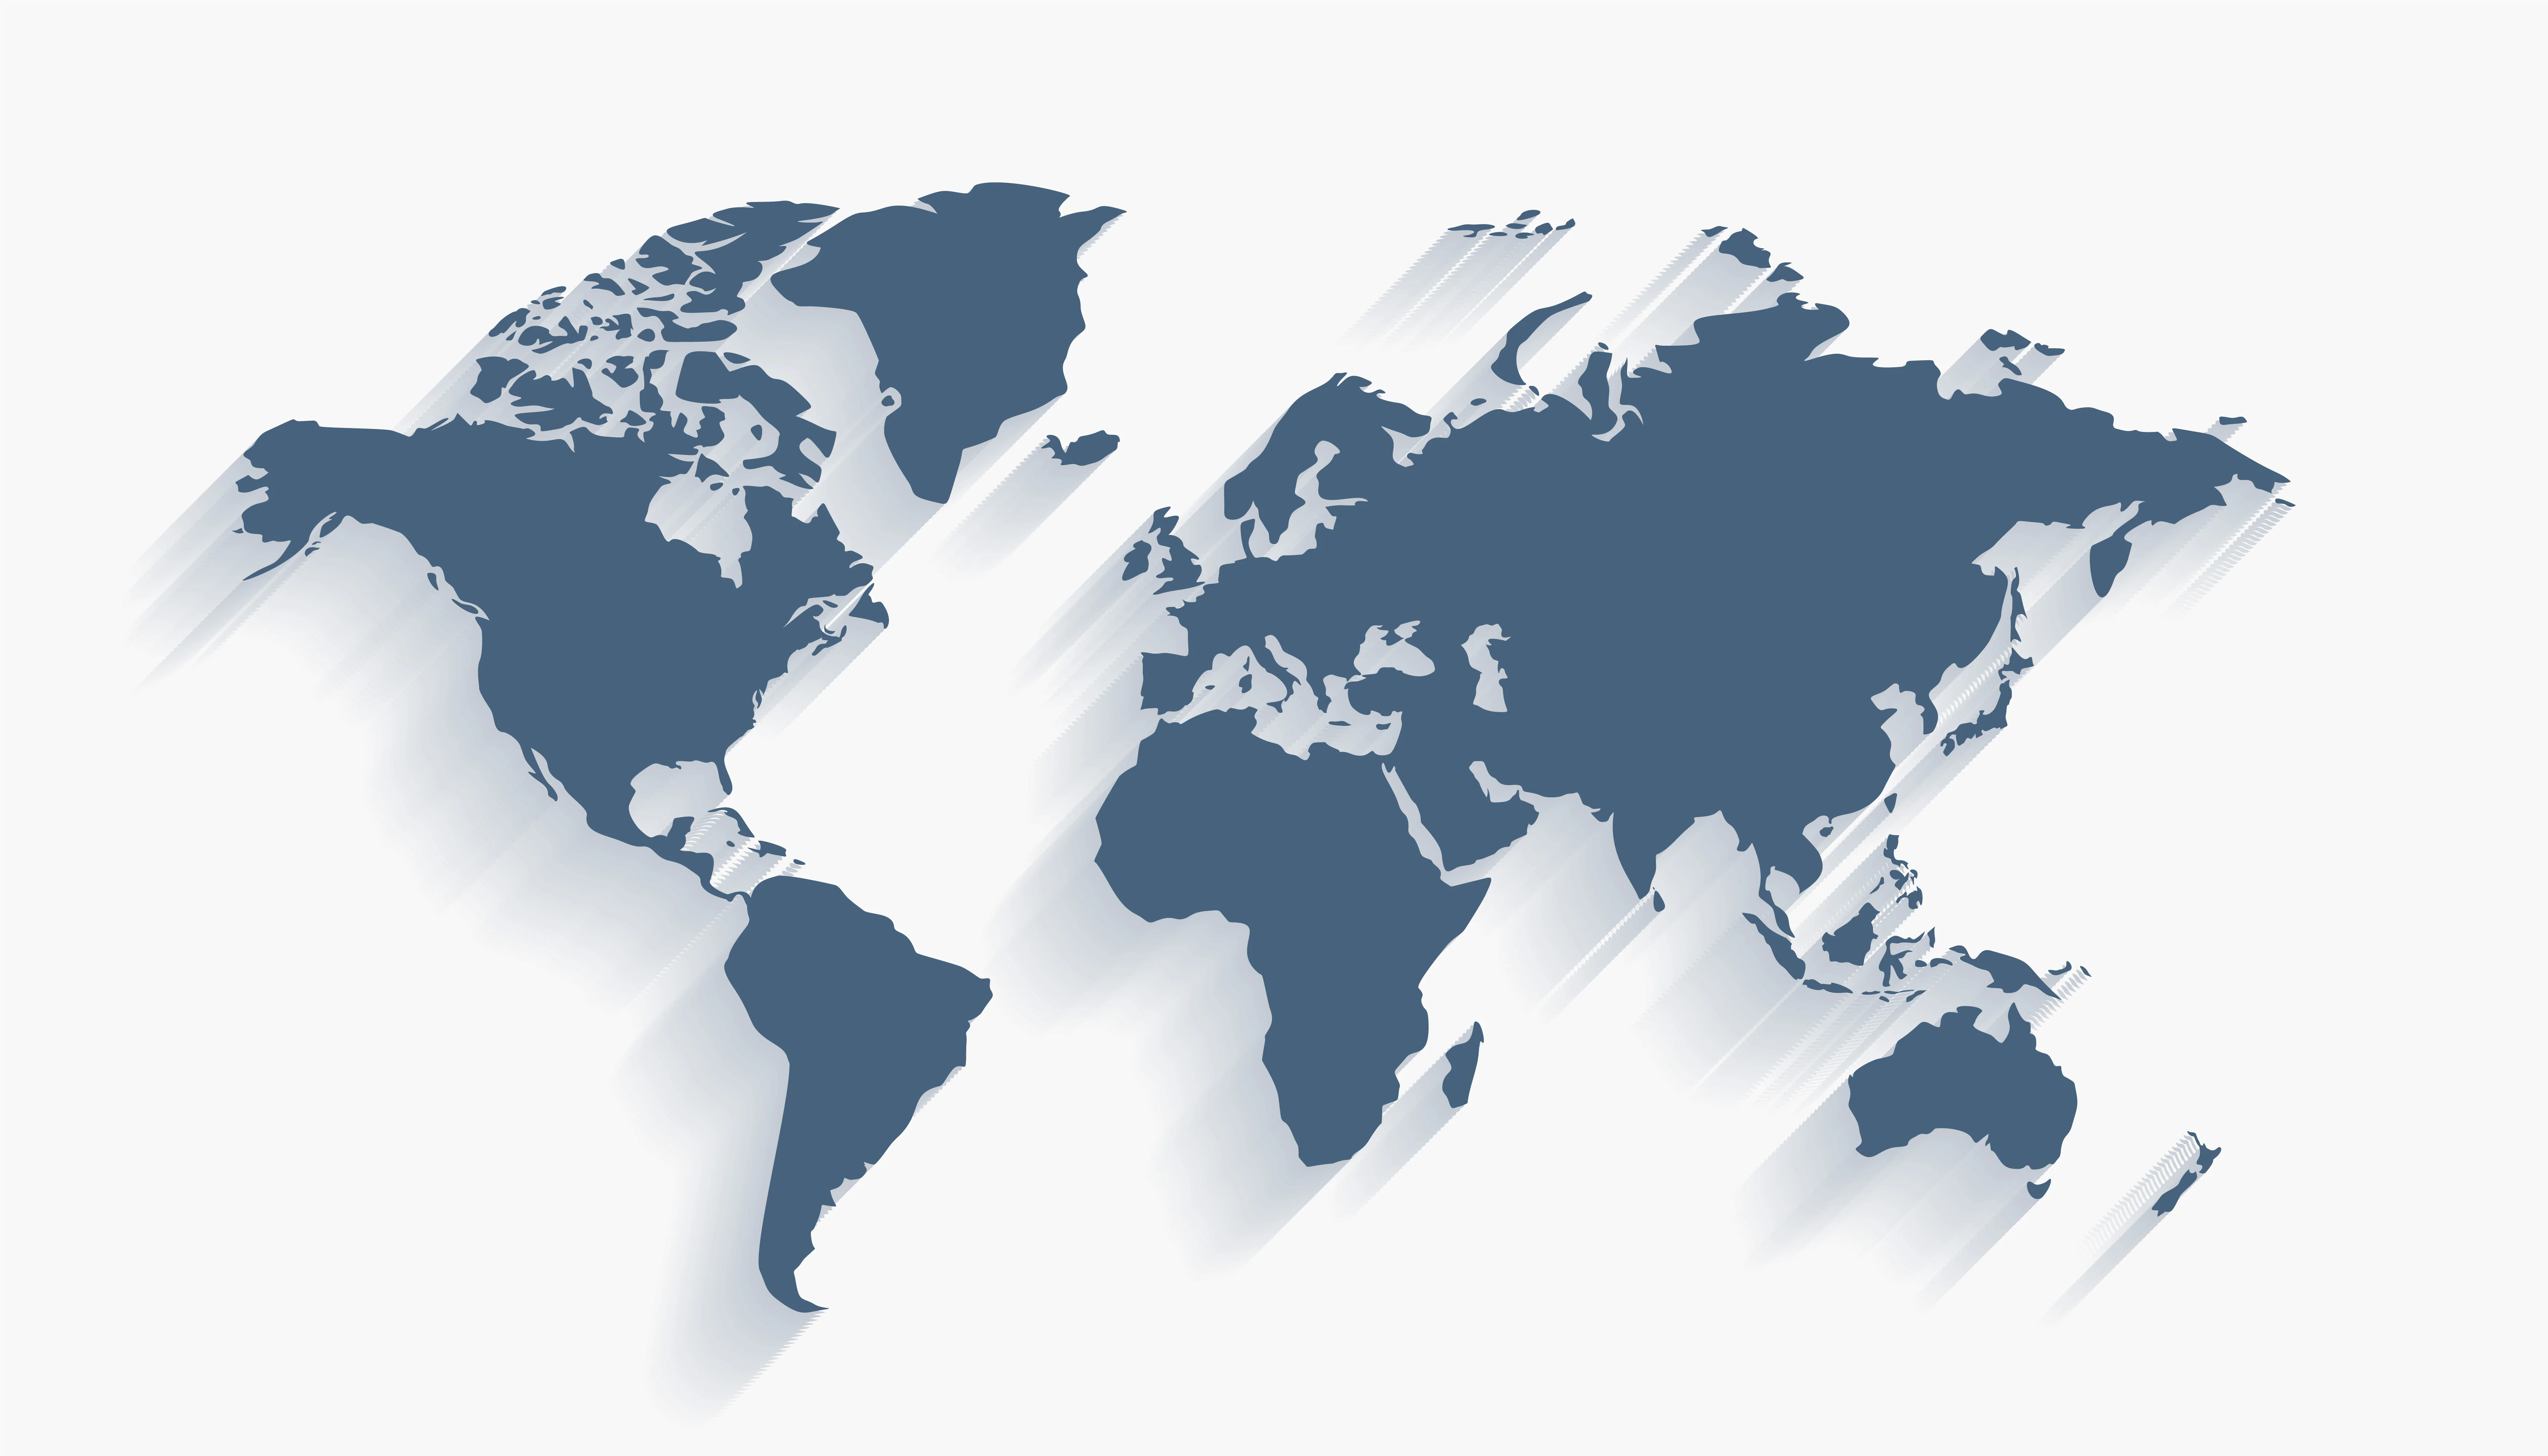
This map uses official World Bank regional aggregates for internet use to show how digital adoption spread unevenly across the world. The slider spans 2000 to 2025, and the comparable regional series begins in 2005, so the first few years show the pre-series lead-in before large-scale adoption accelerates.

Selected year 2025. Regional values follow in the table.

Regional internet use · 2025
RegionPopulation using the internet
North America95.6%
Latin America & Caribbean83.7%
Europe & Central Asia92.4%
Middle East & North Africa58%
Sub-Saharan Africa35.7%
South Asia67.8%
East Asia & Pacific88.4%

Markers show regional internet-use percentages. Larger markers indicate greater adoption; exact stored values are listed below.

World Bank World Development Indicators indicator IT.NET.USER.ZS, with the World Bank listing the ITU World Telecommunication/ICT Indicators Database as the underlying source. World Development Indicators was updated on April 8, 2026.

World Bank indicator pageWorld Bank aggregate API guide

Global context

The stakes extend beyond one portfolio.

International Telecommunication Union · November 10, 2024

79% of people aged 15 to 24 worldwide use the Internet

The ITU reported on November 10, 2024 that youth internet use is 13 percentage points higher than for the rest of the population, but the gap by income level is still large.

Read the source

WHO Regional Office for Europe · September 25, 2024

11% of adolescents showed signs of problematic social media use in 2022

WHO reported on September 25, 2024 that this figure rose from 7% in 2018 to 11% in 2022, and another 12% of adolescents were at risk of problematic gaming.

Read the source

WHO Regional Office for Europe · March 27, 2024

1 in 6 school-aged children experienced cyberbullying

WHO reported on March 27, 2024 that cyberbullying increased between 2018 and 2022, with reports of being cyberbullied rising to 15% for boys and 16% for girls.

Read the source

UNICEF Innocenti · June 2025

1 in 5 10-year-olds in 51 countries lacked internet access at home in 2021

UNICEF Innocenti reported in its June 2025 digital world report that the share increased to two in five in the low- and middle-income countries included in the study.

Read the source

Go deeper

Trusted starting points.

On this device

Settings

Welcome in.

Your theme, audience, name, goal, and saved items stay on this device.

Theme
Privacy & Data

Optional session identity

Sign in

Sign in with Google to personalize your greeting during this browser session. Sign-in does not unlock private content or create a permanent account. Anonymous traffic and performance metrics are measured separately through Cloudflare Web Analytics.

Google is contacted only after you open this account panel.

Review privacy details

Search the fieldbook

Field note